STADE.GG

OVERVIEW
The design journey of Stade.gg, a groundbreaking esports scoring platform by Rooter, first of its kind in esports domain.
Showcases my ability to craft products from research to successful production.
ROLE & DURATION
UI/UX Designer | Rooter
User Research, Product Design, Interaction Design, User Testing
4 Weeks
1. Problem Overview
With the start of Gaming, eSports Tournaments have finally seen the light in late 2021 and finally boomed in 2022 with multiple tournaments happening every month from the leading tournament organizers (TO’s).
With the tournaments getting immense viewership due to leading teams and players participating it becomes important to cover all the important aspects of the tournaments, from scorecards to the facts and the clips.
Goal
-
To create a scoring module for eSports - increase engagement.
-
To create another moat and a trigger point in user life hence improving stickiness.
2. Market Research
Platforms that were researched:
-
Sofascore
-
Fancode
-
Loco
-
Sportskeeda
-
Cricbuzz
-
Fanspace
-
Fanclash
Upon analysis, we discovered that all the platforms share a similar base structure and navigation layout. Cricbuzz and Fancode stood out as perfect examples, with their clean interfaces and smooth navigation.
Conclusion from this research:
-
This platform requires a complex navigation layout where every individual entity or page must have multiple entry points.
-
The scorecards should display all relevant information prominently, with a "Motivation Factor" that encourages the user to click on the card and view the additional information hidden inside.
-
The user interface should be engaging, but not overwhelming.
3. Getting Deeper into the Problem
After analyzing how various scoring platforms handle the problem in different spaces, we decided to delve deeper into the problem and understand how scoring in esports tournaments actually works.
We began by watching broadcasts of esports tournaments, studying how esports casters read the match feed and how the live scorecard dynamically updates based on that feed.

Some more scorecards:

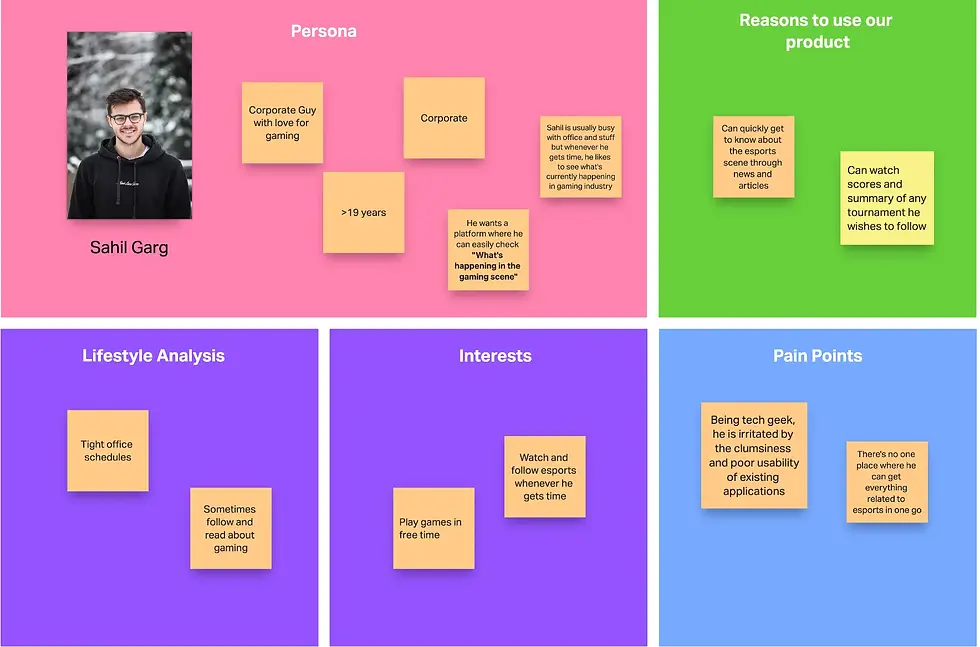
4.1 How the design will be informed based on these personas?
-
The primary incentive for Rooter's current user group, which happens to be the first user group, is to watch their favorite team play in the match or tournament. This group shows wholehearted devotion to following every tournament and therefore requires a more thorough analysis of all the matches.
-
One of our target audience is the second user group, which we aim to reach in order to expand the reach of esports to the masses in India. To generate interest among people who are not currently interested in esports, we need to create a design that is both engaging and informative. For this group, our focus should be on providing "News and Clips" to answer the main question that we wish to put in everyone's mind, which is: "What's happening in the gaming scene?”
5. Information Architecture for the MVP
For making the information architecture, we had two important things in mind:
-
Although the navigation system may be complex, the design must have clear and simple focus points that enable users to quickly access and process the necessary information.
-
How every individual entity can have multiple entry points.

4. Defining the Target Users
We broadly classified our target audience into two user groups:
USER GROUP 1

USER GROUP 2
6. Making the first wireframes
6.1 Page Navigation

6. Making the first wireframes
7.1 Understanding the Game
BGMI tournaments follow a simple format. Sixteen teams, each consisting of four players, participate in a match where the objective is to survive until the end. The scorecard is based on two important factors: the number of kills scored by each team and the number of remaining players on each team. The final score is the sum of the total team kills and the placement points earned in the match.
7.2 Brainstorming on the most important part: “The Score Card”
We made a few iterations of the card based on different focus points:

Following this, we decided to test the design cards with actual BGMI players and viewers to gather their feedback on how they perceive the presented information. This helped us to understand how users interact with the design and identify any areas that require further improvement.
Points to be noted from the testing:
-
Users found it difficult to know whether the team “Godlike Esports” is leading in the current match or the tournament.
-
The points were also mistaken to be total points in the tournament rather than the individual match points.
-
The main motivation factor for BGMI users is whether their favorite team is playing the game or not so we decided to rethink on the scorecards.
After involving the users while creating the cards, we created a lot of new iterations with constantly verifying the architecture with the actual users.

After testing all these cards, we were still not sure about the perfect architecture in which all the information can be easily processed by the user while still be exciting for the gaming audience. This led us to this one:

This card ticked all the boxes in our checklist while testing and seemed to be a good choice.
Main Noticeable points:
-
It shows the current stage, date, match number, maps of the current match.
-
Secondly, the user will be able to see top 3 BGMI teams which is a perfect motivation factor for the users to join in the match.
-
Next, it shows the most relevant information for the current match, which is the number of alive players and teams.
-
We also gave a commentary bar: “OG currently leading with 40 Pts” which will keep updating and will cover the crunch moments from the match and will make the scorecard exciting.
7.3 The Match Page
One of the most important tasks is to design the match page where users can view live scores, as well as summaries of past and upcoming matches.
As previously discussed, we need to display four tabs on the match page:
-
Live
-
Squads
-
Stats
-
Clips
During our research, we discovered that the most exciting aspect of the match is the running feed. This feed keeps users informed of the current situation of the match, along with the status of the alive players and teams. Given this, we decided to allocate a major percentage of the page to the match feed. The feed is designed to replicate the actual gaming experience that users are accustomed to seeing while watching live streams of tournaments.

The feed now displays all live events happening in the match, along with a timer starting from the match's start time. Additionally, the feed component includes a map, as well as the count of alive players and teams.
The FEED Animation: This was a crucial element in the feed. To achieve this, we arranged the events to appear from the left and move upwards, with the latest item at the bottom. This design allows us to display the winner and MVP at the bottom of the feed after the match, which will remain consistent for past matches. Users can scroll down to see all the events that occurred during the match.
The feed is followed by 4 tabs:
1. Live Tab: This tab contains the live points table, which uses the standard format used in most esports tournaments. The table lists teams in descending order of the number of kills, along with their player status (whether they are alive or dead). Teams that have been eliminated are marked as such.
2. Squads: The Squads tab lists all the squads of the teams playing in the current match. Clicking on a team opens a page with the player status of the selected team. To improve the user experience, we have included a dropdown selector on the team page, allowing users to easily switch between teams without having to navigate back and forth repeatedly.

3. Stats: This tab simply shows the table of players with most kills.
4. Clips: This tab shows the clips in the format used by many news and scoring platforms so that users feel the same behavior as stated in the Jacobs Law.
7.4 Handling for Past and Upcoming Matches
After figuring out most of the details for the live match, designing for past and upcoming matches was not a difficult task. For upcoming matches, we displayed empty tables and a timer in the feed that showed when the match was going to start. For past matches, as previously mentioned, we displayed the match winner and MVP at the end of the feed. Users could scroll down to see other events. The live points table showed the total points each team gained in the match, which is the sum of placement points and finish points.
